In this tutorial, you’ll learn how to create an Airport Map Report in Oracle APEX to visualize airport locations on an interactive map. By leveraging your airports table—with columns for latitude, longitude, airport code, and city—you can plot each airport as a marker. We’ll walk through setting up the Map region, writing a SQL query to retrieve the necessary fields, configuring marker layers, and adding tooltips that display airport details on hover. By the end, you’ll have a dynamic map that helps users explore airport locations at a glance.
In Oracle APEX, you can create an Airport Map Report that plots airport locations on an interactive map using latitude and longitude data from your US_AIRPORTS table. Follow these steps:
1. Prepare Your Data
• Ensure your table includes columns for latitude, longitude, airport code, and city (e.g., CITY, STATE, AIRPORT_CODE, LATITUDE, LONGITUDE).
• Optionally, add descriptive columns like AIRPORT_NAME or TERMINAL_COUNT for tooltips.
2. Create the Map Region
• In App Builder, open the page where you want the map.
• Click Create → Region.
• Choose Map as the region type.
• Enter a Title (e.g., Airport Locations).
3. Define the SQL Source
Under the Map region’s Source section:
SELECT
  latitude  AS lat,
  longitude AS lon,
  airport_code  AS id,
  city || ', ' || state AS tooltip_text
FROM US_AIRPORTS
• lat and lon map to location.
• id is a unique key.
• tooltip_text combines city and state for hover info.
4. Configure the Layer
Under Layer settings:
• Layer Type: Point
• Latitude Column: LAT
• Longitude Column: LON
• Tooltip Column: TOOLTIP_TEXT
• (Optional) Marker Icon: choose a custom pin or built‑in icon.
• (Optional) Clustering: enable if you have many airports close together.
5. Set Map Attributes
Under Attributes:
• Map Provider: Oracle Maps or Google Maps
• Initial Zoom: e.g., 4 (to show continental coverage)
• Initial Center: pick a central latitude/longitude, e.g., (39.8283, -98.5795) for US center
• Enable controls: Zoom, Pan, Scale Bar as needed
6. Add a Click Action (Optional)
To open a detail page when a marker is clicked:
• Under Layer → Marker Click → set Action to Redirect
• Target: Page in this application (e.g., Page 20)
• Set Items: P20_AIRPORT_CODE = #ID#
7. Style and Appearance
• Under Appearance, adjust Height (e.g., 500px)
• Use Template Options to control border and shadow
• Add custom CSS in the page’s Inline CSS if you want unique styling for your map container
After saving, run the page. You’ll see each airport plotted as a marker; hovering displays the city and state, and clicking can navigate to an airport detail page. This Airport Map Report leverages APEX’s declarative map features to provide an interactive geographic visualization of your data.
Example
To create a Map Report in Oracle APEX that displays airports using the AirportsLatLon table with airportname, IATACode, Latitude, and Longitude columns, follow the steps below.
Prerequisites:
The AirportsLatLon table should contain the columns:
airportname (VARCHAR)
IATACode (VARCHAR)
Latitude (NUMBER)
Longitude (NUMBER)
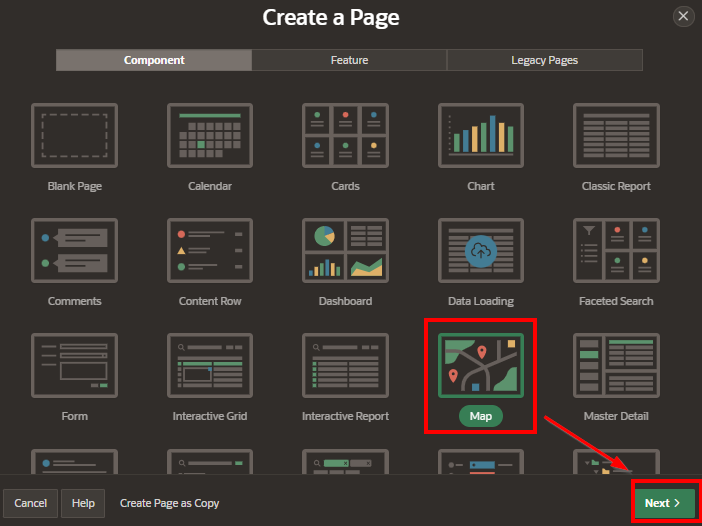
Step 1: Create a New Page for the Map
Click on Create to create a new page.
Select Chart > Map from the options.
Click Next.
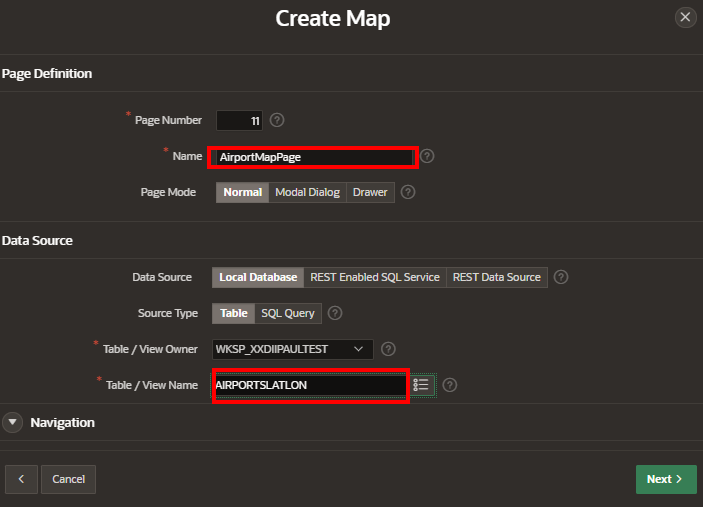
Step 2: Configure the Map Region
Choose Map Type: Select Google Maps or another map provider (e.g., OpenStreetMap). Google Maps is a common choice, but you can choose based on your needs.
Define the Data Source (If done manually):
Select SQL Query as the data source for the map.
Write the SQL query to pull the required data from the AirportsLatLon table. The SQL query should look like this:
SELECT airportname AS title,
IATACode AS description,
Latitude AS latitude,
Longitude AS longitude
FROM AirportsLatLon;
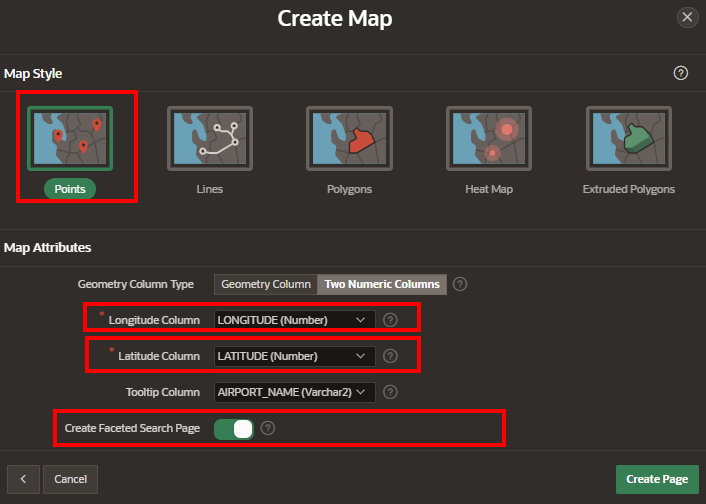
Columns Mapping:
Title: Set to airportname (to display the airport name in the map popup).
Description: Set to IATACode (to display the IATA code in the popup).
Latitude: Set to Latitude (the latitude of the airport).
Longitude: Set to Longitude (the longitude of the airport).
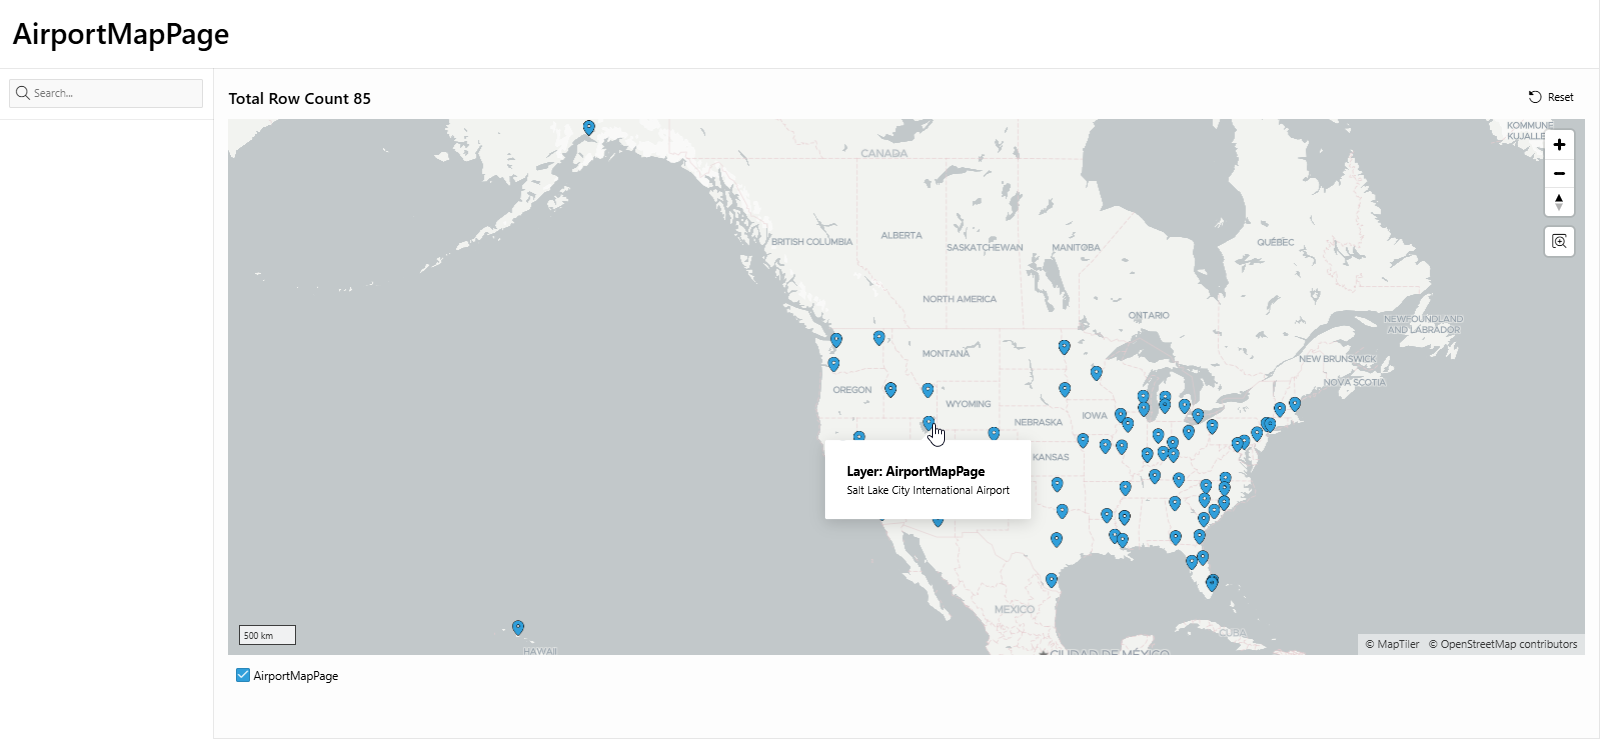
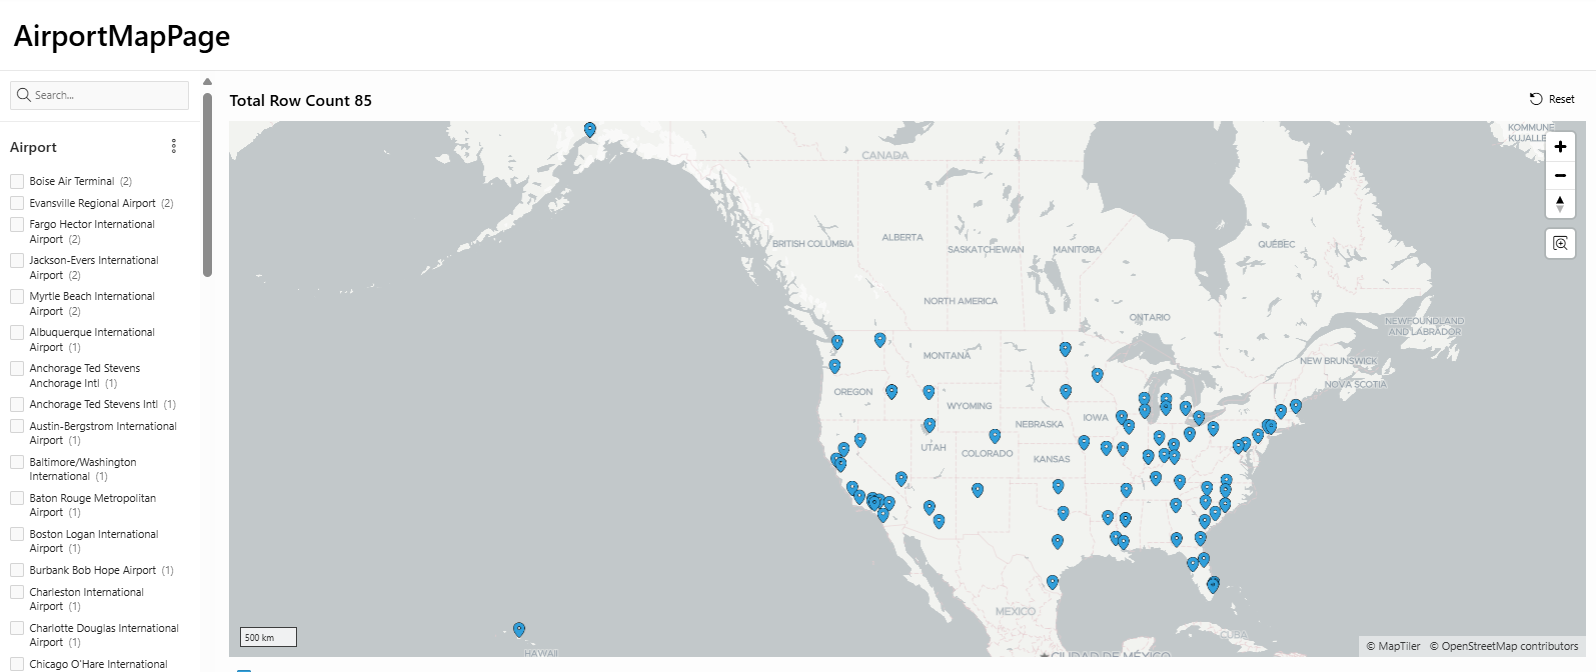
Result:
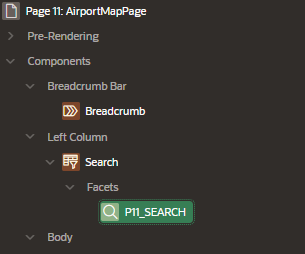
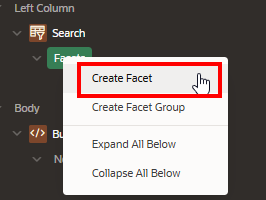
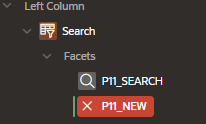
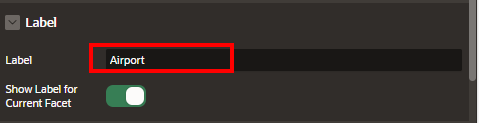
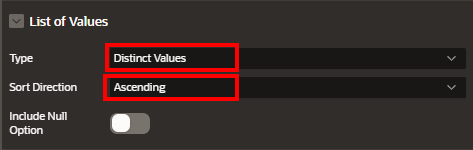
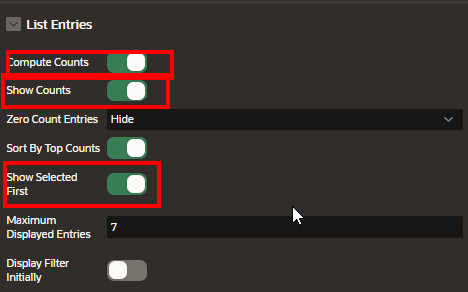
Lets add more Faceted searches

Step 3: Set Map Region Attributes
Center of the Map:
Set the initial center of the map to a default latitude and longitude, such as 37.7749 and -122.4194 (which corresponds to the center of the U.S., or adjust it to your preferred area).
For example, for the United States:
Latitude: 37.7749
Longitude: -122.4194
Zoom Level: Set a Zoom Level that suits the geographical coverage you want (e.g., zoomed out for a continent view or zoomed in for city-level details).
Zoom Level: Choose a value that allows users to see multiple airports at once (e.g., 5 for regional coverage, 10 for more detailed zoom).
Map Markers: Configure how the markers will be displayed on the map.
You can use Icons to represent different types of airports if you have that classification in your data.
If you do not have specific icons, APEX will use a default map marker for each airport.
Popup Info: Set up the Popup Info when a user clicks on an airport marker. The popup can show details like the airport name and IATA code.
The Title will display the airportname.
The Description will display the IATACode.
Step 4: Customize Map with Additional Settings (Optional)
Clustering (Optional): If your map contains a lot of airports and markers are overlapping, you can enable Marker Clustering. This will group markers together when zoomed out, improving the map’s readability.
Enable Dynamic Interaction: If you want to allow users to interact with the map and select multiple filters (e.g., by region or airport code), you can add Faceted Search or Filters to the map.
Adding Other Data Points: You can enhance the map with additional data, such as airport images or links to flight data.
Step 5: Save and Run the Map
After configuring the map region settings, click Next and choose any additional report settings you want.
Click Finish to save the page.
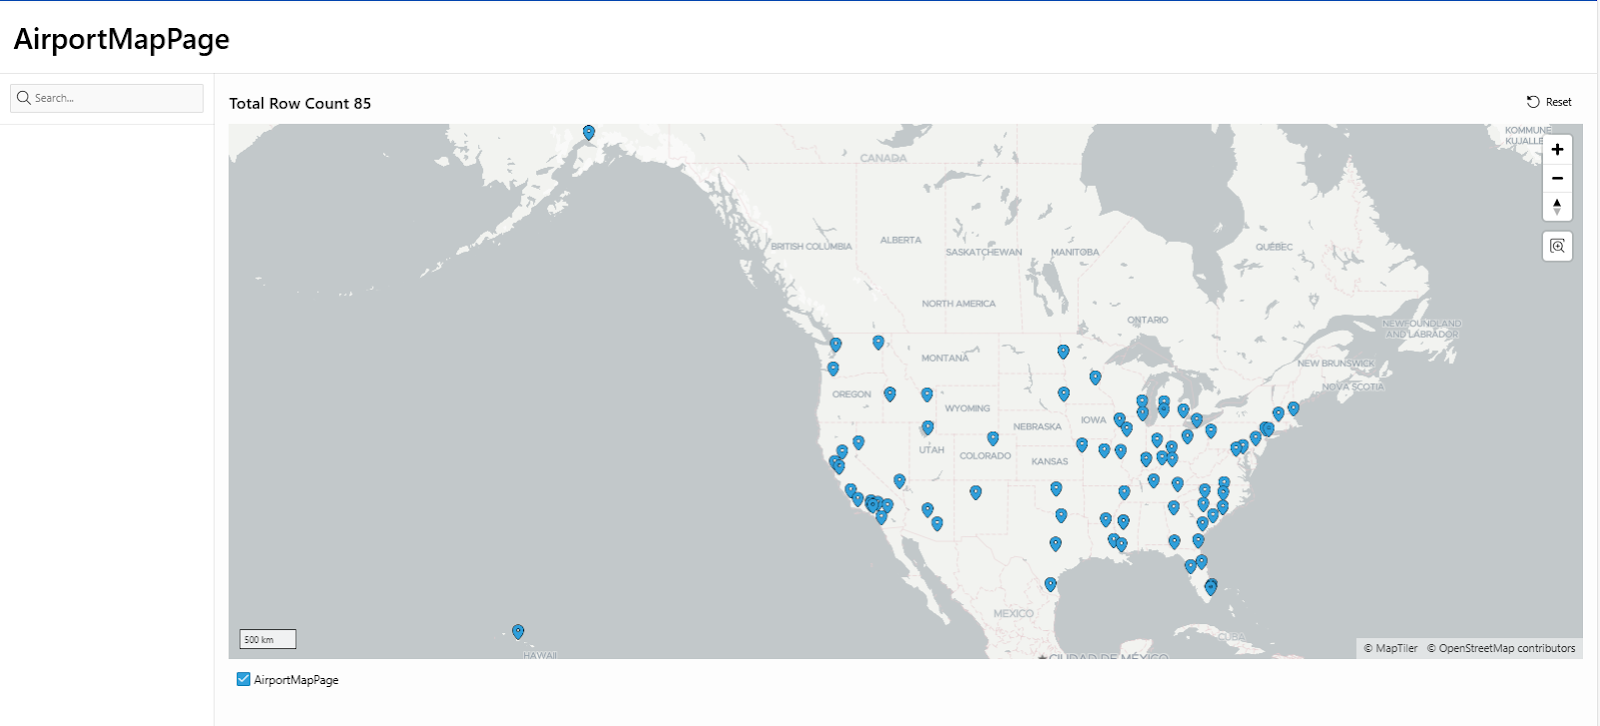
Step 6: Run and Preview the Report
After creating the map, click Run at the top-right of the page.
You should now see a map with markers representing each airport in your AirportsLatLon table. Clicking on a marker will show a popup with the airport name and IATA code.
Example SQL Query for Map Data Source
SELECT airportname AS title,
IATACode AS description,
Latitude AS latitude,
Longitude AS longitude
FROM AirportsLatLon;
This query will pull the airport names, IATA codes, and coordinates (latitude and longitude) for plotting the map markers.
Additional Customization
Filter Data on the Map: You can add filtering options to your page (e.g., drop-downs for selecting regions or airport types) so that users can narrow down the map markers.
Styling: You can customize the look and feel of your map by editing the page styles or adding custom CSS.
By following these steps, you can create a Map Report in Oracle APEX that displays airport locations using the AirportsLatLon table. The markers will be placed based on the Latitude and Longitude, and clicking on each marker will show more details about the airport, such as its name and IATA code.
Creating an Airport Map Report not only makes your data more engaging but also adds valuable context to your application. Users can instantly see where each airport is located, click markers for more information, and even link out to detailed airport pages if needed. By combining spatial visualization with APEX’s declarative map features, you’ll deliver a richer, more intuitive user experience that brings your airport data to life.


