Introduction:
Creating interactive and user-friendly map reports in Oracle APEX has become increasingly valuable for applications that rely on geospatial data. One powerful way to enhance usability is by combining faceted search with a map report—allowing users to dynamically filter and explore data based on specific attributes. In this blog post, we’ll walk through how to build a Faceted Search Map Report in Oracle APEX using the USCG_DATA table. This table includes location-based records such as lighthouses, stations, or assets from the U.S. Coast Guard. By leveraging built-in APEX components, you can empower users to quickly filter map data through intuitive facets such as district, type, or status.
To create a Faceted Search Map Report in Oracle APEX using the USCG_DATA table, follow these steps carefully. This guide assumes your USCG_DATA table includes location-based records such as name, type, district, and geographic coordinates (latitude and longitude).
1. Prepare Your Table (USCG_DATA):
Ensure that the table includes at minimum the following columns:
-
ID– primary key -
NAME– name of the asset -
TYPE– type of facility (e.g., lighthouse, station) -
DISTRICT– regional grouping -
LATITUDEandLONGITUDE– coordinates for map placement
2. Create a New Page with Faceted Search and Map Report:
In APEX, go to your application and click Create > Page.
Choose Faceted Search as the report type.
Select Based on a Table or View and choose USCG_DATA.
In the options, check the box Include Map and continue.
Give the page a meaningful name, such as USCG Map Search.
Click Finish to create the page.
3. Configure the Facets:
APEX will auto-generate some facets based on column data types. You can fine-tune them:
-
Navigate to Page Designer, and under the Facets section:
-
Set
DISTRICTas a Checkbox Group -
Set
TYPEas a Select List or Link List -
Add a Search Bar on the
NAMEcolumn to allow keyword searches
-
4. Set Up the Map Attributes:
Scroll to the Map region and configure these properties:
-
Location Column Type: Latitude/Longitude
-
Latitude Column:
LATITUDE -
Longitude Column:
LONGITUDE -
Title Column:
NAME -
Subtitle or Tooltip: use
TYPEorDISTRICT
You can also enable clustering if your dataset is large.
5. Add Navigation or Detail Links (Optional):
To link each map point to a detail page:
-
In the Map Layer settings, use the Link section to define a dynamic action or a page link.
-
Pass the
IDor other identifying column as a URL item.
6. Run and Test the Page:
Save your changes and run the page.
Use the facet controls to filter data. The map should automatically update to reflect the selected criteria.
Optional Enhancements:
-
Add custom icons based on
TYPEusing marker settings -
Include a region that lists results below the map
-
Use Dynamic Actions to highlight or zoom to specific areas when a facet changes
With this setup, your users will have a highly interactive way to explore geographic data using intuitive filters, and Oracle APEX will handle the underlying complexity of filtering and visualization seamlessly.
A Faceted Search Map Report in Oracle APEX allows users to filter and visualize geographic data on an interactive map using multiple search facets. This tutorial will guide you through the process of setting up a faceted search with a Map Chart report using the USCG_DATA table.
Understanding the USCG_DATA Table
The table contains geospatial data in GeoJSON format within the GEOMETRY column. The key columns for creating a map report are:
Longitude: Extracted from JSON_VALUE(GEOMETRY, '$.coordinates[0]')
Latitude: Extracted from JSON_VALUE(GEOMETRY, '$.coordinates[1]')
Attributes: Various PROPERTIES_* fields, such as PROPERTIES_MAG (magnitude), PROPERTIES_PLACE (location), and PROPERTIES_TIME (timestamp).
This data can be used to display locations on a Map Chart while allowing filtering through Faceted Search.
Step 1: Create a New Page
Open Oracle APEX and navigate to your application.
Click Create Page → Select Faceted Search.
Click Next, choose your table USCG_DATA, and set the Primary Key to ID.
Click Next, then Create.
Step 2: Configure the Faceted Search Region
The Faceted Search component will allow filtering the map data based on relevant attributes.
Go to the Faceted Search region settings.
Add facets for filtering, such as:
Magnitude (PROPERTIES_MAG) → Numeric Range
Location (PROPERTIES_PLACE) → Search Box
Earthquake Type (PROPERTIES_TYPE) → Select List
Time (PROPERTIES_TIME) → Date Range Picker
Tsunami Alert (PROPERTIES_TSUNAMI) → Checkbox
Click Save.
Step 3: Create the Map Report
Go to Page Designer and add a new Map Chart region.
Set Region Source to:
SELECT
ID,
JSON_VALUE(GEOMETRY, '$.coordinates[0]') AS LONGITUDE,
JSON_VALUE(GEOMETRY, '$.coordinates[1]') AS LATITUDE,
PROPERTIES_MAG AS MAGNITUDE,
PROPERTIES_PLACE AS PLACE,
PROPERTIES_TYPE AS EVENT_TYPE,
PROPERTIES_TSUNAMI AS TSUNAMI_ALERT
FROM USCG_DATA
WHERE (:P1_MAG_MIN IS NULL OR PROPERTIES_MAG >= :P1_MAG_MIN)
AND (:P1_MAG_MAX IS NULL OR PROPERTIES_MAG <= :P1_MAG_MAX)
AND (:P1_PLACE IS NULL OR LOWER(PROPERTIES_PLACE) LIKE LOWER('%' || :P1_PLACE || '%'))
AND (:P1_EVENT_TYPE IS NULL OR PROPERTIES_TYPE = :P1_EVENT_TYPE)
AND (:P1_TSUNAMI_ALERT IS NULL OR PROPERTIES_TSUNAMI = :P1_TSUNAMI_ALERT)
Under Attributes, set:
Longitude Column: LONGITUDE
Latitude Column: LATITUDE
Title Column: PLACE
Popup Info:
<b>Location:</b> &P1_PLACE.<br>
<b>Magnitude:</b> &P1_MAGNITUDE.<br>
<b>Event Type:</b> &P1_EVENT_TYPE.<br>
<b>Tsunami Alert:</b> &P1_TSUNAMI_ALERT.
Layer Type: Point
Step 4: Connect Facets to the Map Report
Navigate to Faceted Search > Filters.
Assign facet items to the report’s query parameters:
Magnitude → P1_MAG_MIN and P1_MAG_MAX
Location → P1_PLACE
Event Type → P1_EVENT_TYPE
Tsunami Alert → P1_TSUNAMI_ALERT
Set Refresh Region to refresh the Map Chart when filters are applied.
This approach provides a powerful Faceted Search Map Report in Oracle APEX, allowing users to interactively filter and explore geospatial data. By leveraging JSON functions and dynamic filters, this solution enhances the visualization of location-based data.
EXAMPLE:
Using the following code:
SELECT
ID,
JSON_VALUE(GEOMETRY, '$.type') AS geometry_type,
JSON_VALUE(GEOMETRY, '$.coordinates[0]') AS longitude,
JSON_VALUE(GEOMETRY, '$.coordinates[1]') AS latitude,
"PROPERTIES_TZ" ,
"PROPERTIES_CDI" ,
"PROPERTIES_GAP" ,
"PROPERTIES_IDS" ,
"PROPERTIES_MAG",
"PROPERTIES_MMI",
"PROPERTIES_NET" ,
"PROPERTIES_NST" ,
"PROPERTIES_RMS" ,
"PROPERTIES_SIG" ,
"PROPERTIES_URL" ,
"PROPERTIES_CODE" ,
"PROPERTIES_DMIN",
"PROPERTIES_FELT" ,
"PROPERTIES_TIME" ,
"PROPERTIES_TYPE" ,
"PROPERTIES_ALERT",
"PROPERTIES_PLACE" ,
"PROPERTIES_TITLE" ,
"PROPERTIES_TYPES" ,
"PROPERTIES_DETAIL",
"PROPERTIES_STATUS" ,
"PROPERTIES_MAGTYPE" ,
"PROPERTIES_SOURCES" ,
"PROPERTIES_TSUNAMI",
"PROPERTIES_UPDATED" ,
"APEX$SYNC_STEP_STATIC_ID" ,
"APEX$ROW_SYNC_TIMESTAMP"
FROM USCG_DATA;
Create a new Report:

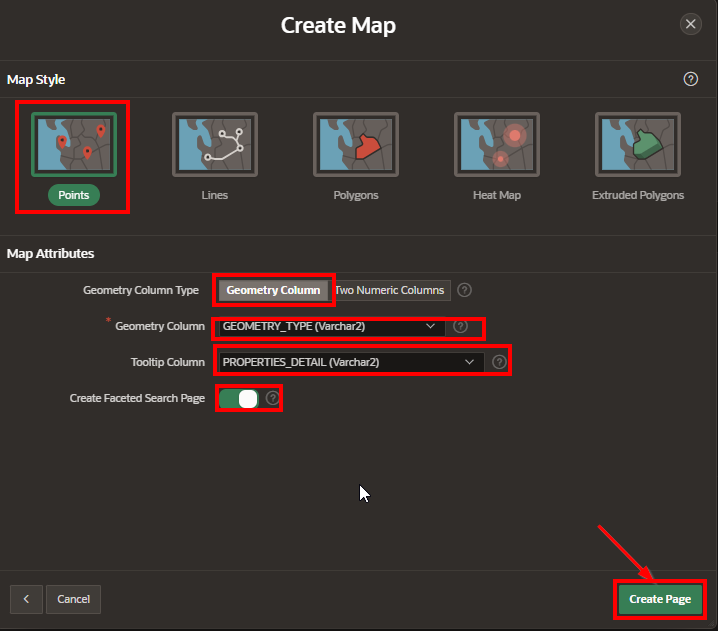
Select the MAP.

Create a Map – Page definition.

Add the query found at the start of this section into the SQL Select box.

Select the table:
Select Next.

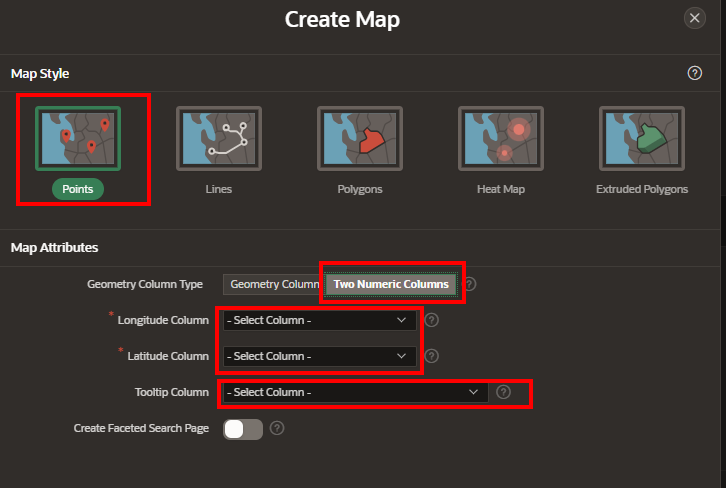
Set the Map’s Settings.
Depending on your data type, you can also do the following:
Add Facet Searches
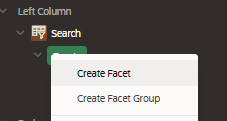
Step 1. Add the facet search on the left hand side, in the Search region.
Step 2. Add the type as “Checkbox Group” and Give the label a name for the Region.
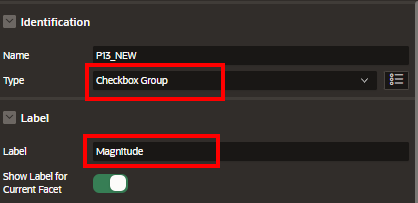
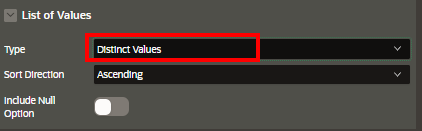
Step 3. List of value type: “Distinct Values”
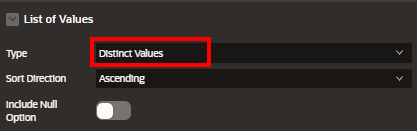
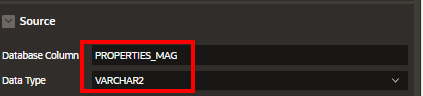
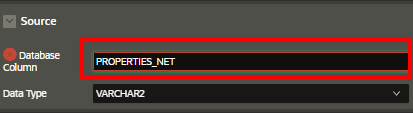
Step 4. Set the Database Column that we want to use for searching.
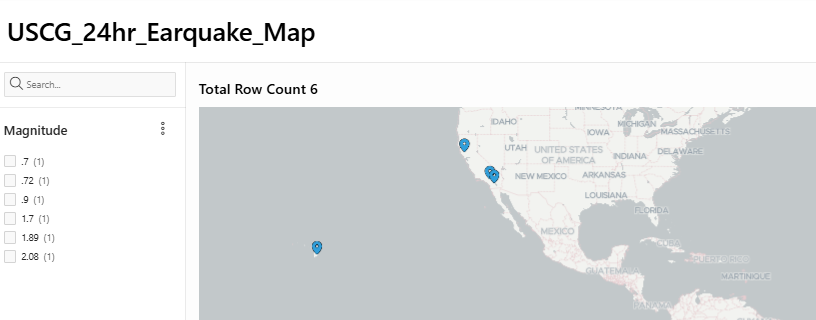
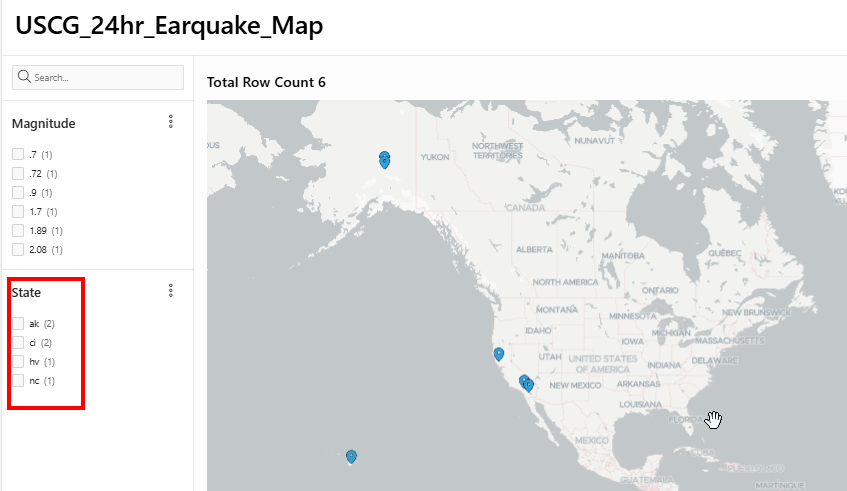
Results:
Add a Facet Search
Lets add another faceted search for States where the earquake occurred. For this we will use the “PROPERTIES_NET” field from the database table.
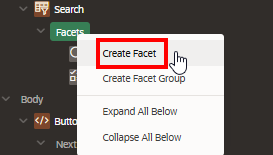
Step 1. Add the facet
Step 2. Change the Label to “State
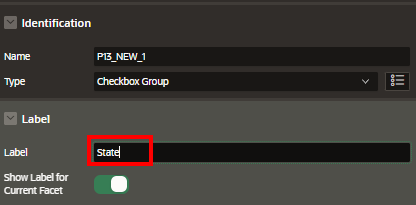
Step 3. Ste the List of Values to “distinct Values”
Step 4. Set the Source to the column “PROPERTIES_NET”
Step 5. Save and Run

Results:
Conclusion:
With just a few steps, Oracle APEX enables developers to create a dynamic and visually engaging Faceted Search Map Report that provides both high usability and powerful filtering options. Using the USCG_DATA table as a base, we connected geospatial data with facets to allow users to interactively narrow down the results and visualize the filtered data directly on a map. This type of report is ideal for operational dashboards, situational awareness tools, and geographic exploration apps. By combining faceted navigation with map visualization, your APEX application can deliver both data clarity and an enhanced user experience.


