Cards Report
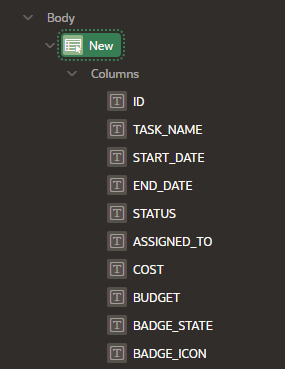
A cards page consists of individual boxes, which resemble index cards, laid out on a page. Each card displays three pieces of information: Card Title, Description Column, and Additional Text Column. First, you select a table or view on which to build the page. Second, you select the Card Title, Description Column, and Additional Text Column.
Display data at a glance using information tiles that can easily include an image.
Choose between three cards page layouts: Grid, Float, or Horizontal (Row).
Provides summary information from a modern layout with one-click access to more details on another report or form page.
A cards page features an orderly layout of information tiles. Developers choose between three layouts: Grid, Float, or Horizontal (Row).
Features:
Customize every aspect of a cards region's UI (including layout, appearance, icon, badge, and media).
Declaratively create links from a cards page by adding actions. Action types include Button, Full Card, Title, Subtitle, or Media.
Supports advanced HTML expressions including template directives for client-side conditional formatting.
Classic Report
Display data in a simple report region.
Update data by including a report and update form combination during creation.
Column sorting configurable.
A classic report features a simple report page based on the formatted result of a SQL query.
Features:
Report can display as a standard application page or as a modal dialog.
Enable the Include Form option to create a report and update form combination.
Enable column sorting in Page Designer by selecting a column and configuring Column, Sorting attributes.
The most versatile report as it is template-driven. Choose from the predefined report templates, including Media List, Comments, Timeline, Badge List, Value Attributes Pairs, and so on. Or, create your own template to customize and visualize data.
Download the report as a CSV, HTML, Excel, or PDF.
Supports Report Layouts to format PDF exports.
Limitations compared to other report types:
Using templates requires changing the SQL query column names to match the chosen template (for row templates)
No support for scroll pagination or virtual scrolling. Other pagination options available.
No column header groups, frozen columns, and template directives.
Faceted Search Report
Display and filter data using an intuitive experience users recognize from ecommerce sites (a left Search region and report region).
Show search results as cards or a classic report.
Includes built-in search capability.
Users select facets in the Search region to narrow down the search results.
A faceted search page displays and filters data using an intuitive experience users recognize from ecommerce sites (a left Search region and report region). The report region displays search results as cards or a classic report.
Features:
Select options from facets in the left Search region to narrow down search results.
Set filters using facets that show possible values together with the occurrence count within the result set.
Built-in search capability.
Optionally include a chart for any facet.
Toggle between a bar chart (which is the default) and pie chart type.
Create facet groups for data models having multiple flag columns.
Interactive Grid Report
Display data in a searchable, customizable report that supports inline editing at runtime using the mouse or keyboard.
Enable end users to create highly customized reports. Users can alter the report layout by using either the Column Heading menu or Actions menu.
Move columns by using the Actions menu, Column dialog, or by dragging and dropping with the mouse.
Save customizations and report layout by saving a private or alternative report just for yourself, a public report, or as a primary report that can be viewed by others.
Save a report layout by creating an Alternative or Private report.
Download or email the report as a CSV, HTML, PDF, or Excel file.
Enable and disable editing capability at by editing attributes in Page Designer.
If editable:
Select options from the Row Action menu.
Add and remove rows or edit data by directly editing a cell.
An interactive grid presents data in a searchable, customizable report. Includes similar customization capabilities available in interactive reports plus the ability to rearrange the report interactively using the mouse or keyboard.
Features:
An interactive report page features a searchable, easily customizable report.
Features:
Report can display as a standard application page or as a modal dialog.
Enable the Include Form option to create a report and update form combination.
Built-in search capability.
Extensive customization capabilities using menus or inline editing.
Turn editing on or off using the region Attribute, Edit, Enabled.
Built-in search capability.
For both editable and non-editable reports, users can change the report layout and create private reports:
Column Heading menu - Change the report layout with Control Break, Aggregations, Freeze, Hide, and Filter.
Actions menu:Columns - Configure the columns to show or hide.
Filters - Create filters to alter the display.
Data - Sort, Aggregate, Refresh, Flashback.
Format - Control Break, Highlight, Stretch Column Widths.
Selection - Cell Selection, Copy to Clipboard, Refresh Rows.
Chart - Create chart.
Report - Create, edit, and manage saved Private or Alternative reports.
Download - Download or email the report as a CSV, HTML, PDF, or Excel file
If editable, users can edit the data directly:
Row Actions menu - Single Row View, Add Row, Duplicate Row, Delete Row, Refresh Row, Revert Changes.
Add Rows - Add new rows by clicking the Add Row button.
Edit Rows - Edit a row by selecting or double-clicking a cell with the mouse, editing the content, and clicking the Save button.
Limitations compared to other report page types:
Rows are fixed height. No variable height option.
Does not remember current page.
Tabular form limitations: submit selected rows, always edit for small number of records
Interactive report features not supported: Pivot view, Group By view, Computed columns, and complex filters.
Change the report layout and create private reports using menus:
Column Heading menu: Change the report layout with Sort Ascending, Sort Descending, Hide Column, Control Break, and Filter.
Actions menu:
Columns - Configure the columns to show or hide.
Filters - Create filters to alter the display.
Data - Sort, Aggregate, Compute, Flashback.
Format - Control Break, Highlight, Rows Per Page.
Chart - Create a chart.
Group By - Group sets of results by one or more columns with Group By.
Pivot - Pivot reports transpose rows into columns to generate results in a cross tab format.
Report - Create, edit, and manage saved Named reports.
Download - Download or email the report as a CSV, HTML, Excel, or PDF.
Subscription - Subscribe to report updates in CSV, HTML, Excel, or PDF format.
Limitations compared to other report page types:
No scroll pagination.
Freeze columns not supported.
Column groups not supported.
Charts not as powerful as interactive grid.
Smart Filter Report
A smart filters page features a single search field at the top of the page and a search results report (classic report, cards, map, or calendar). While a smart filter behaves similarly to faceted search, it features a more space efficient layout.
Features
Display data using a single search field region at the top of the page and results report.
Offers a more compact UI when compared to faceted search.
Search results report can display as a classic report, cards, map, or calendar.
End users select filters that display as suggestion chips.
Includes built-in search capability.
Configurable search suggestions
Includes a search field at the top of the page with filters that display as suggestion chip.
The Search Results can display as a classic report, cards, map, or calendar.
Clicking a filter name displays a list of values.
Clicking to right of a suggestion chip changes it to an applied filter chip and moves to the Applied Filters Area. Clicking the applied filter chip again displays a list.
Built-in search capability.


No comments:
Post a Comment